Predictably, we’re starting to see that old bugbear start to rear its ugly head again:
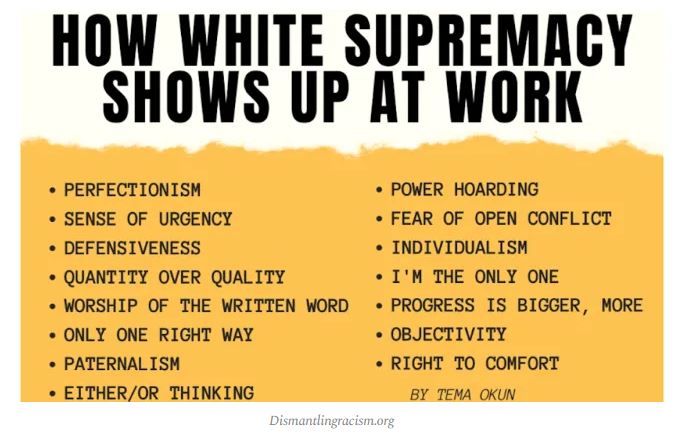
Just to address Item #2:
She describes “a sense of urgency” as a damaging characteristic, arguing that it discourages inclusivity, long-term thinking, and learning from mistakes.
This “urgency” argument has even been used to criticize white workers who complete projects quickly or work overtime. Some activists also claim deadlines and strict arrival times are unfair because they don’t account for cultural differences—such as “Black time.”
“Black time” (or “Colored People’s Time” / CPT) is a term sometimes used to describe habitual tardiness in Black communities. NPR’s Karen Bates explains that she learned about CPT as meaning “clock-challenged” and used as a self-referential joke within Black culture.
Still, some academics take this idea seriously.
“Unjust experiences of time are the reason that due dates and deadlines are so harmful—they amplify racism, sexism, classism, and ableism that already deprive the most vulnerable in our communities of their basic rights and dignities,” certain professors argue.
We used to call this “Africa Time” back in my old homeland, and it wasn’t very fashionable amongst Blacks during the apartheid era (because they’d get fired for habitual tardiness), but since the Blessed Mandela’s ANC took over, it has become very much a thing (surprise, surprise).
And the other items on the list are equally wrong-headed and utter bullshit — prime examples of “you should have to change the institution to accommodate me”, and not the other way round.
Bloody hell, as if the airlines aren’t already using Black Time.
Not that this Oklin pustule is a solo act, mind you. Here’s another one:
A University of North Dakota history professor who studies the American West believes monuments depicting the pioneers “reinforce white supremacy.”
In an interview this week with KJZZ Phoenix, Cynthia Prescott (pictured) discussed her research on pioneer monuments, including a book that argues the artwork promotes “white cultural superiority” and “gender stereotypes.”
Much like with Confederate monuments, the professor said America should re-examine artwork honoring American settlers.
“A lot of people have talked about Confederate monuments in particular, as being monuments that were put up in the late 19th, early 20th centuries for the purpose of enshrining a racial hierarchy. And through my work, I argue that Western pioneer monuments were doing very similar cultural work,” she told KJZZ.
Fucking hell; left to non-Whites, the U.S. would still have the Mississippi River as its western border and not the Pacific.
Yup, it’s just another “deconstruction” of history to change it into something that’s more to the bullshit philosophy of Wokism and “racial justice”.
Just for identification purposes, here are the two above pseudo-academics, just to make recognition easier:


I know; you never expected them to look like that, did you?
And by the way, the “bugbear” I referred to in the opening is not “White supremacy”, but the continued efforts of academia to undermine the very fabric of our nation.


