Jackals Of The Press #1,254

I know, I know:  if you want fair and balanced reporting, don’t read Britain’s Daily Mail.  Yet I persist, despite nonsense like this, because I am weak.

This particular article starts off well, showing people getting their last kicks in before the latest totalitarian bollocks from H.M. Government, in the usual Daily Mail  fashion:


All well and good, and nothing puts me in a good mood like Train Smash Women (like I said, I am so weak).

However, the DM then eschews standard journalistic principle — I know, I know — and turns a general-interest piece into a study of the Chinkvirus re-emergence in Britishland.  For reasons best known to themselves, they publish some scawwwwy-looking graphs with the usual crap predictions from Doom & Gloom Inc.:

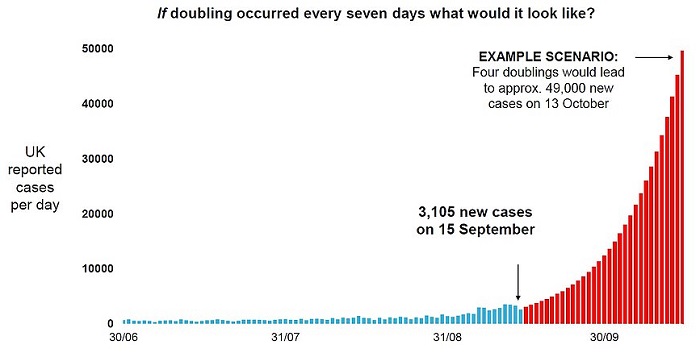
…although they do have the grace to give some actual numbers:

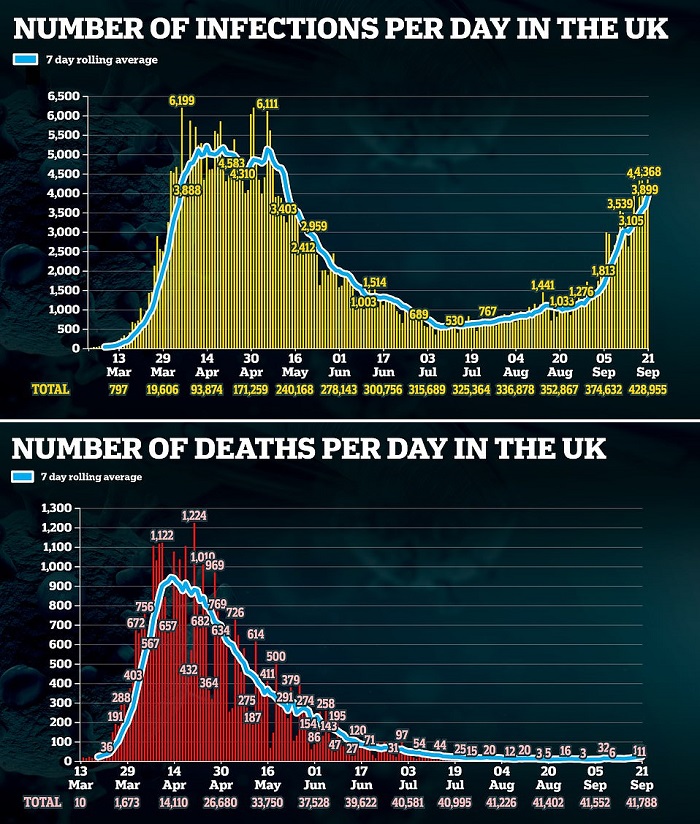
…which of course shows that even though hospitalizations are increasing, the death rate (which is the important number) isn’t doing anything alarming.

But non-alarms don’t boost readership, so the JOTP publish two graphs which show how scawwwy things could get, only they use Spain and France — no doubt because those two countries’ experience bolsters the alarmism:

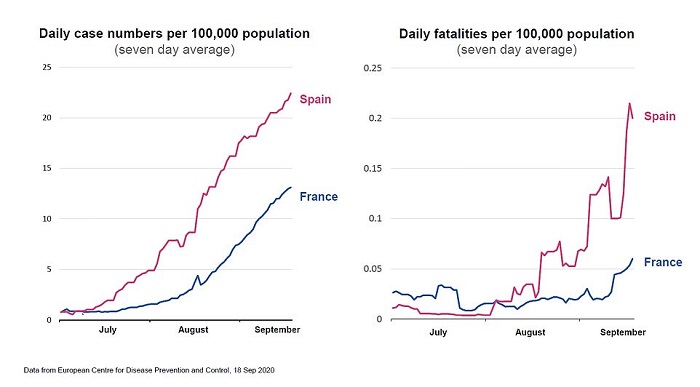
Of course, what gives this bullshit away is the way the graphs are scaled.  Note that the right-hand graph (of daily fatalities) has a very fine scale, which despite the steep climb, simply means that the Spanish fatality rate has gone from much less than 1 to just over 2 deaths per million population  (0.2 per hundred thousand = 2 per million), while the Frogs have gone from pretty much zero to 5 per ten million.

I don’t have access to those countries’ accident stats, but I imagine that 2 per million and 5 per 10 million respectively are rather less than the death rates from, oh, falling down stairs or drowning in a bucket of wine.

So the DM took a perfectly okay article about people getting their last unfettered drinks in, and added all that pseudo-scientific bullshit.  Of course, those are really subjects for two different articles (one of the prime journo principles being:  don’t try to tell two stories in a single article).

Were it not for daily pics of the skinny Amanda Holden and the not-so-skinny Kelly Brook, I’d give them up altogether.


But did I already mention how weak I am?

Headache

Just when I thought I’d figured it all out, comes shit like this:

‘They are the sort of equations that arise when you try to study something that evolves in time but also depends on space.
‘For example, like the wind in a wind tunnel you want to model the flow of air then that of course depends on time because it changes over time but it also depends on space – the velocity of the air is different at different points in the wind tunnel.
‘So if you have a system like this which furthermore evolves under the influence of randomness.
‘So if you have randomness that enters the game then that’s described by stochastic partial differential equation.’

I used to work with people like this when designing predictive algorithms, and I would place bets with myself as to how long (measured in seconds) it would take before I lost track of the conversation completely and the speech became unintelligible.  Usually, it was about twenty seconds.

It gets worse.  The reason I used “20 seconds” in the above sentence is because I actually kept count, over the year’s worth of discussions and meetings, of the times.  Then I created a distribution chart — bell-shaped, of course, with the most common incidence around 20.

Yeah, I was a fucking geek, too.  Just a much more limited one.

By the way, if you read the article — and you should — there’s a glaring (but non-mathematical) error.  Call it the Obama Fallacy, and see if you can spot it.

Calling Bollocks

Here’s an example of “studies” that just set my hair on fire:

The LEAST reliable used cars revealed
Warrantywise has published data from its Reliability Index for older cars
A minimum of 100 examples of each car is needed to provide a reliability score

…but here’s where the turd hits the punchbowl:

It measures reliability based on the volume and cost of repairs to vehicles

Including cost of repairs means that.. wait for it… cars like Bentley and Audi are going to fall to the bottom of the list, regardless.

Here’s the scenario:

  • one of their “reliable” cars (e.g. the Dacia Sendero, a complete POS) may have ten problems after its warranty expires, but because the average cost of repair is $100 (Dacias being made of plastic and scrap metal), its score comes to 1000
  • an Audi A7 breaks down only twice, but its average cost of repair is $1,500 (because when quality stuff does break, it’s expensive to fix), giving it a score of 3000 — so the Audi is three times less “reliable” than the Dacia, according to the study.

But in terms of actual (instead of cost-weighted) reliability, your Dacia was in the shop ten times, compared to the Audi’s twice.

I’m not saying that’s what happened in the study (I don’t have access to the raw data), but that’s the problem when you add irrelevant factors to an equation.

The real problem lies with the title.  If Warrantywise had called their study “Total Cost Of Post-Warranty Ownership”, it would have given the output a better foundation.

Or if they were going to stick with reliability, they should have ignored cost and instead stressed weighting factors of “frequency of breakdown” and “magnitude of failure” (brake lights fail, no big deal;  transmission dies, much more serious).  That, at least, would have given prospective buyers a clue.

All that said, I’d still get one of these (with only 12,000 miles usage)

…over a poxy Mitsubishi anything.

(See what I did there?  About the same thing as Warrantywise did.  It’s called “bias”.)

Anyway:  if you can afford to buy it, you should be able to afford to maintain it.

And can ignore silly studies.

Bad Stats

Back when I worked for the Great Big Research Company in Johannesburg, I had a boss who had the unnerving habit of doing random checks on my calculations.  (I should point out for my Readers who were born after we discovered the wheel that computations were done not with slide rules but with the newfangled invention called a “calculator” — which could do only the basic math functions of addition, subtraction, multiplication and division — and the literally thousands of numbers were taken off pages and pages of computer printouts from a thing called a “mainframe”.)

Anyway, if the Poison Dwarf (as we not-so-jokingly called him) discovered a single mistake, he would tear it all up and make me redo the entire job, with the rationale that “If I can’t trust one thing, I can’t trust anything.”  The result, after only a couple of these episodes, was that I not only took an inordinate amount of time in performing the calculations, but spent almost as much time rechecking everything to make sure that absolutely every statistic or number I presented to my clients was 100% correct, and they could take the actions I recommended with complete confidence in the strength of the data.

The time spent in doing all this was based on another of the Poison Dwarf’s aphorisms:  “There’s never enough time to do the job properly, but there always seems to be enough time to do things over.”  Well, I never had enough time to do things over — I had client meeting deadlines — so I had to get it right the first time, regardless of the time taken.

That habit persisted with me for the rest of my working career.

I say all this so everyone will know exactly where I stand on bullshit like this (with emphasis added):

A young Florida resident who died in a motorcycle accident is included in the state’s official COVID-19 death count, a state official reveals.
FOX 35 News in Orlando discovered this after asking Orange County Health Officer Dr. Raul Pino about two young COVID-19 patients in their twenties who died, and whether they had any preexisting conditions that contributed to their deaths.
“The first one didn’t have any. He died in a motorcycle accident,” Pino said. Despite this shocking answer, Pino was not aware of this person’s data being removed from the state tally when asked.
“I don’t think so. I have to double-check,” Pino answered. “We were arguing, discussing, or trying to argue with the state. Not because of the numbers — it’s 100… it doesn’t make any difference if it’s 99 — but the fact that the individual didn’t die from COVID-19… died in the crash.”

You stupid fucking quack.  It’s not whether it makes a difference between 99 and 100 — it’s how many more mistakes of this kind have occurred in your compilation of the data.

Remember the Poison Dwarf:  “If I can’t trust one thing, I can’t trust anything.” 

So if one death (1%, in this case) was incorrectly attributed to the Chinkvirus, how many more cases are incorrect?  10%?  20%?  90%?  We don’t know, because the numbers were obviously not checked after being submitted.

Here’s something from Powerline which makes the same case quite succinctly:

Funny, but not so funny.

Here’s the thing.  A lot of decisions, very weighty and momentous decisions, are being made based on the data our much-vaunted medical establishment is presenting.  States’ economies are being damaged or destroyed, people’s livelihoods ditto, and I’m not even going to start to estimate the social cost of foolish governmental decisions taken on the basis of what may turn out to be fatally-flawed data.

So I’m going to mimic the Poison Dwarf (for the first time ever):  I’m not going to trust a single fucking piece of data these assholes present to us, ever again.  As far as I’m concerned, it’s all lies and bullshit, and I don’t trust any of them.

Chinks In The Armor

As much as the ChiComs claim to be a global economic powerhouse, we should always be aware that much of the economic numbers that come out of China are either flat-out lies or at best, exaggerations.  Hence:

The most important thing to understand about Chinese statistics is not that they are necessarily manipulated from the top. Certainly that happens too, as it does in every country in the world. Look no further than Wang’s example for that. But much of the manipulation of Chinese data actually comes from the lower levels. China is a country of over a billion people, but it has no unified or centralized statistical reporting system. Data is gathered at the local level and passed up the chain until it reaches the central government. The bureaucrats in charge of that system enjoy professional success and advancement when their numbers conform to the expectations and directives of the party. As a result, the numbers can be inflated to give the impression of success or moderated in order to avoid attention.

An example of how this can lead to catastrophe comes out of China itself, in the not-so-distant past:

In the 1958-1961 Great Leap Forward, Chairman Mao’s disastrous attempt to shift a backward agrarian economy to a modern industrial powerhouse, the failure of the statistical system contributed to catastrophe on a grand scale. Mao’s plan, such as it was, required producing an agricultural surplus that could be sold to fund investment in a modern industrial base. Whipped into a patriotic frenzy, and knowing that their future depended on meeting unrealistic targets for the production of grain, local officials engaged in rampant exaggeration of output.
But reality was distorted at a cost. The higher the production figures, the greater the tax owed to the central government. In some areas, the exaggerated claims were so great that the entire harvest had to be handed over as tax, used to fund investments and extravagances that China could ill afford. In some parts of the country, the only crops left behind were grown by villagers in secret locations, away from the acquisitive eye of the local production teams. But such success stories were few and far between. Tens of millions died in history’s greatest man-made famine.

Communists are renowned, of course, for perverting the facts to suit their own ends.  Remember this over the coming political election season here in the U.S., as our own home-grown Marxists fabricate lies and misquote or otherwise falsify data, simply to advance their political agenda.